Admin Guide
Instrument Type
Create Instrument Type
- You can categorize the instruments required for various laboratory operations into different Instrument Types (e.g., Centrifuges, Agitators, Microscopes, etc.).
- Within each instrument type, you can create and manage the specific instruments needed for these operations.
- To create an Instrument Type, you need to provide the necessary data in the "Name" field on the "Create Instrument Type" page by clicking icon in the instrument page.
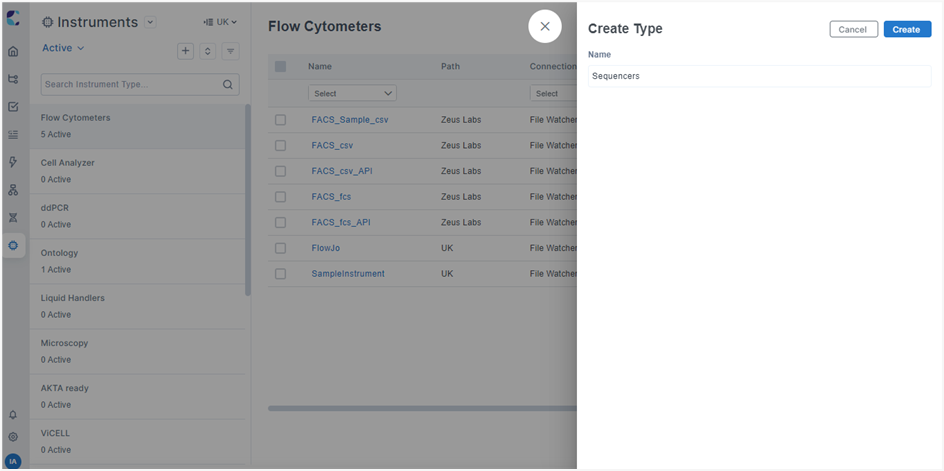
NOTE
The Instrument Type Name should be unique; duplicate names are not allowed.
View Instrument Type
- In the Instruments page, you can view all the instrument types along with the count of active instruments under each type.
- Upon clicking on the Instrument type, the list of Instruments would be displayed.
- You can also switch between Active and Inactive filter to view instruments based on their active or inactive status.
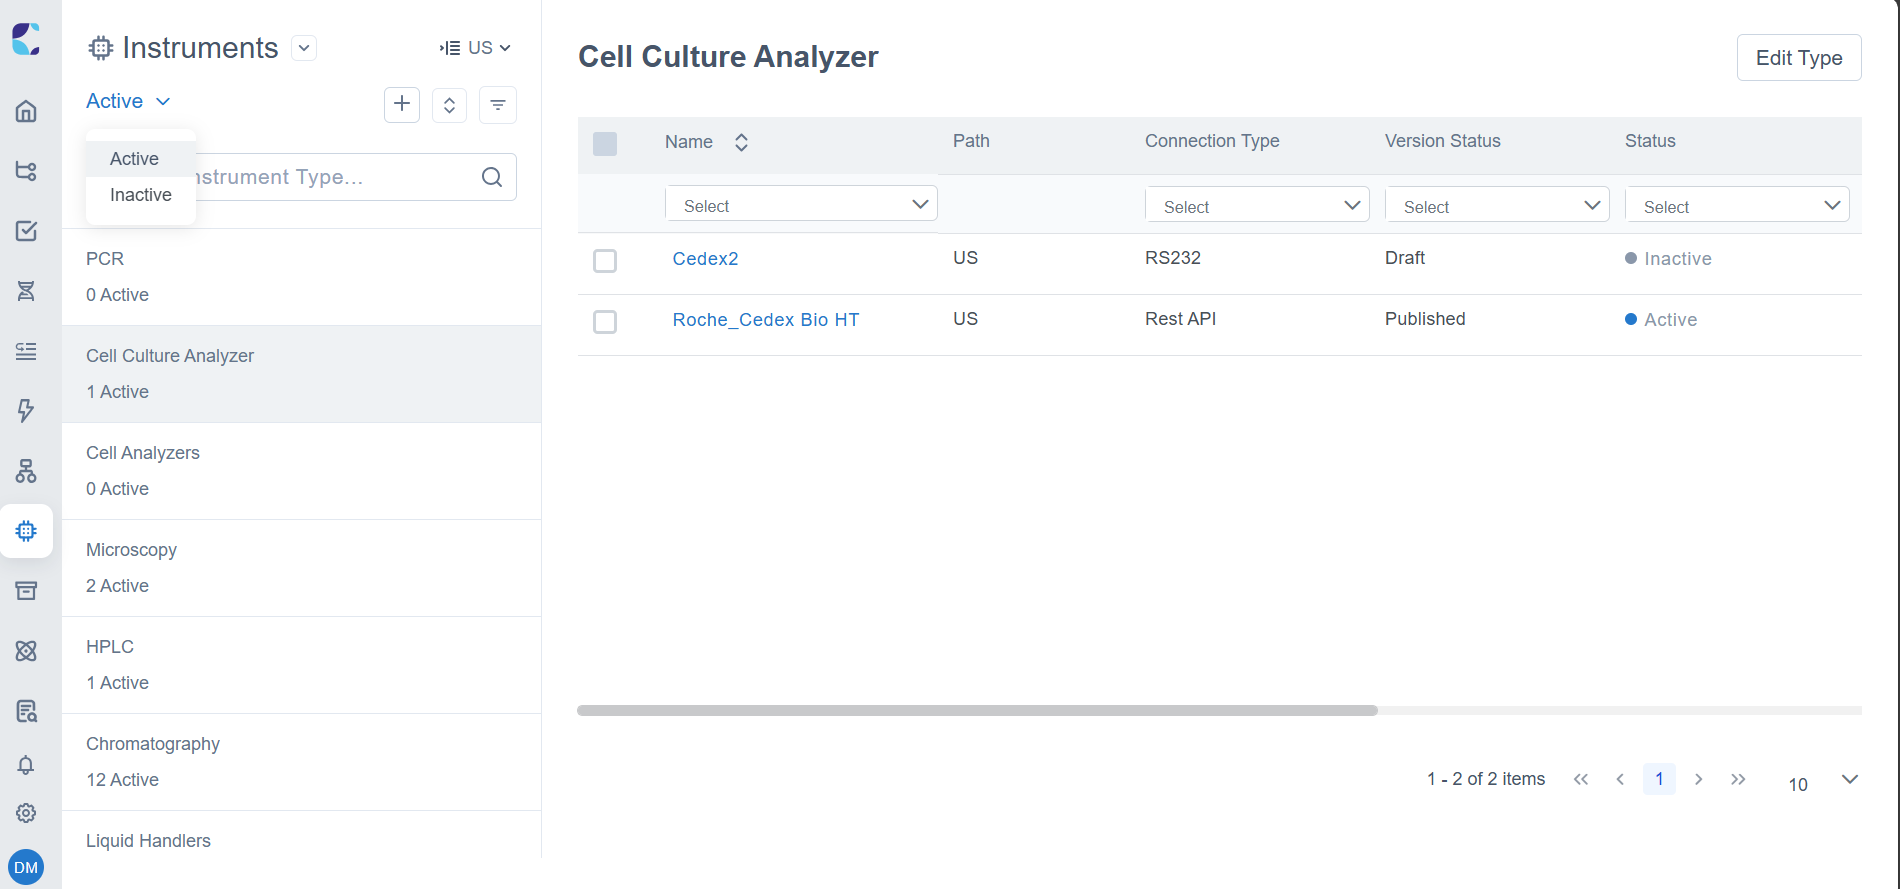
Instrument type list
NOTE
Instrument Type is not associated to an organization path. Irrespective of User’s roles and permissions, all Instrument Type names would be displayed in the left panel, however users can view Instruments within the types only when they have specific access to it.
Search Instrument Type
You can search the required Instrument type by providing the name of the Instrument type in the search field or filter the list based on the Instruments under the Instrument type.
Sort
By default, Instrument Type is sorted based on the last modified date (Recent to Old). Instrument Type can be sorted based on the following:
- Recent to Old
- Old to Recent
- Ascending (A to Z)
- Descending (Z to A)
Edit Instrument Type
- To edit an Instrument type, click on an Instrument type and click “Edit Type”.
- You can update the instrument's name or deactivate the instrument if it's no longer in use.
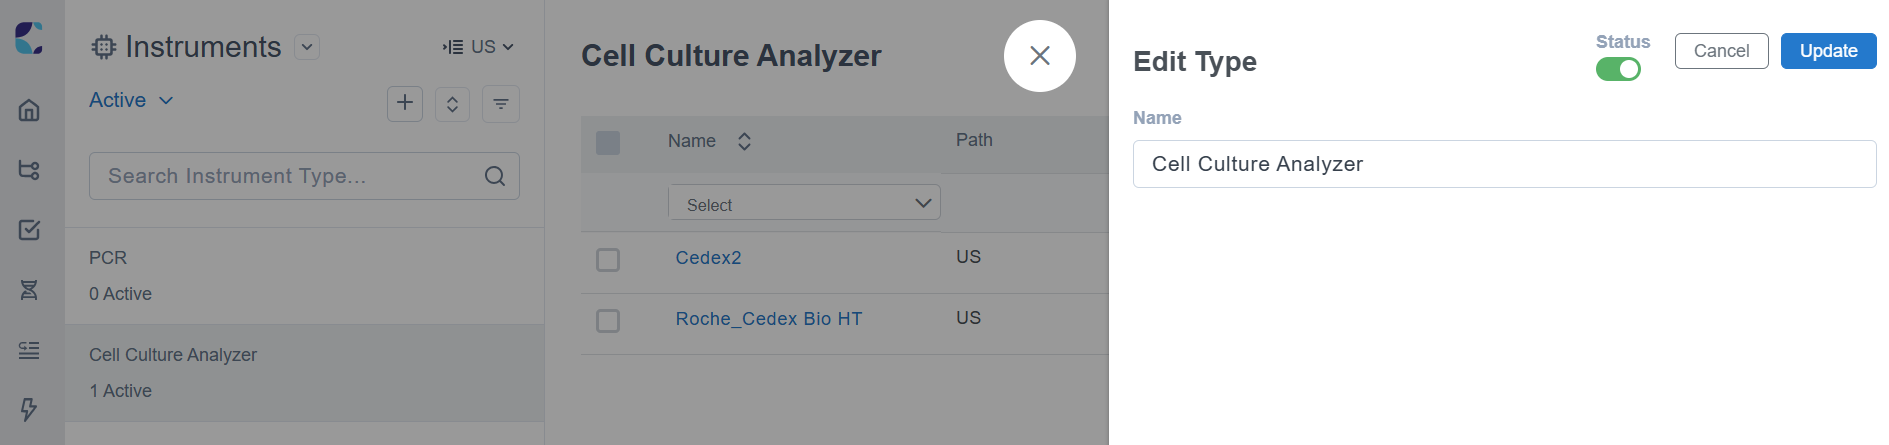
NOTE
While inactivating Instrument types, status of Instruments created within the Instrument type remain unaffected.
Instruments
Instrument configuration
To create an instrument under an instrument type, select “Create Instrument” option by clicking icon in the Instrument page.
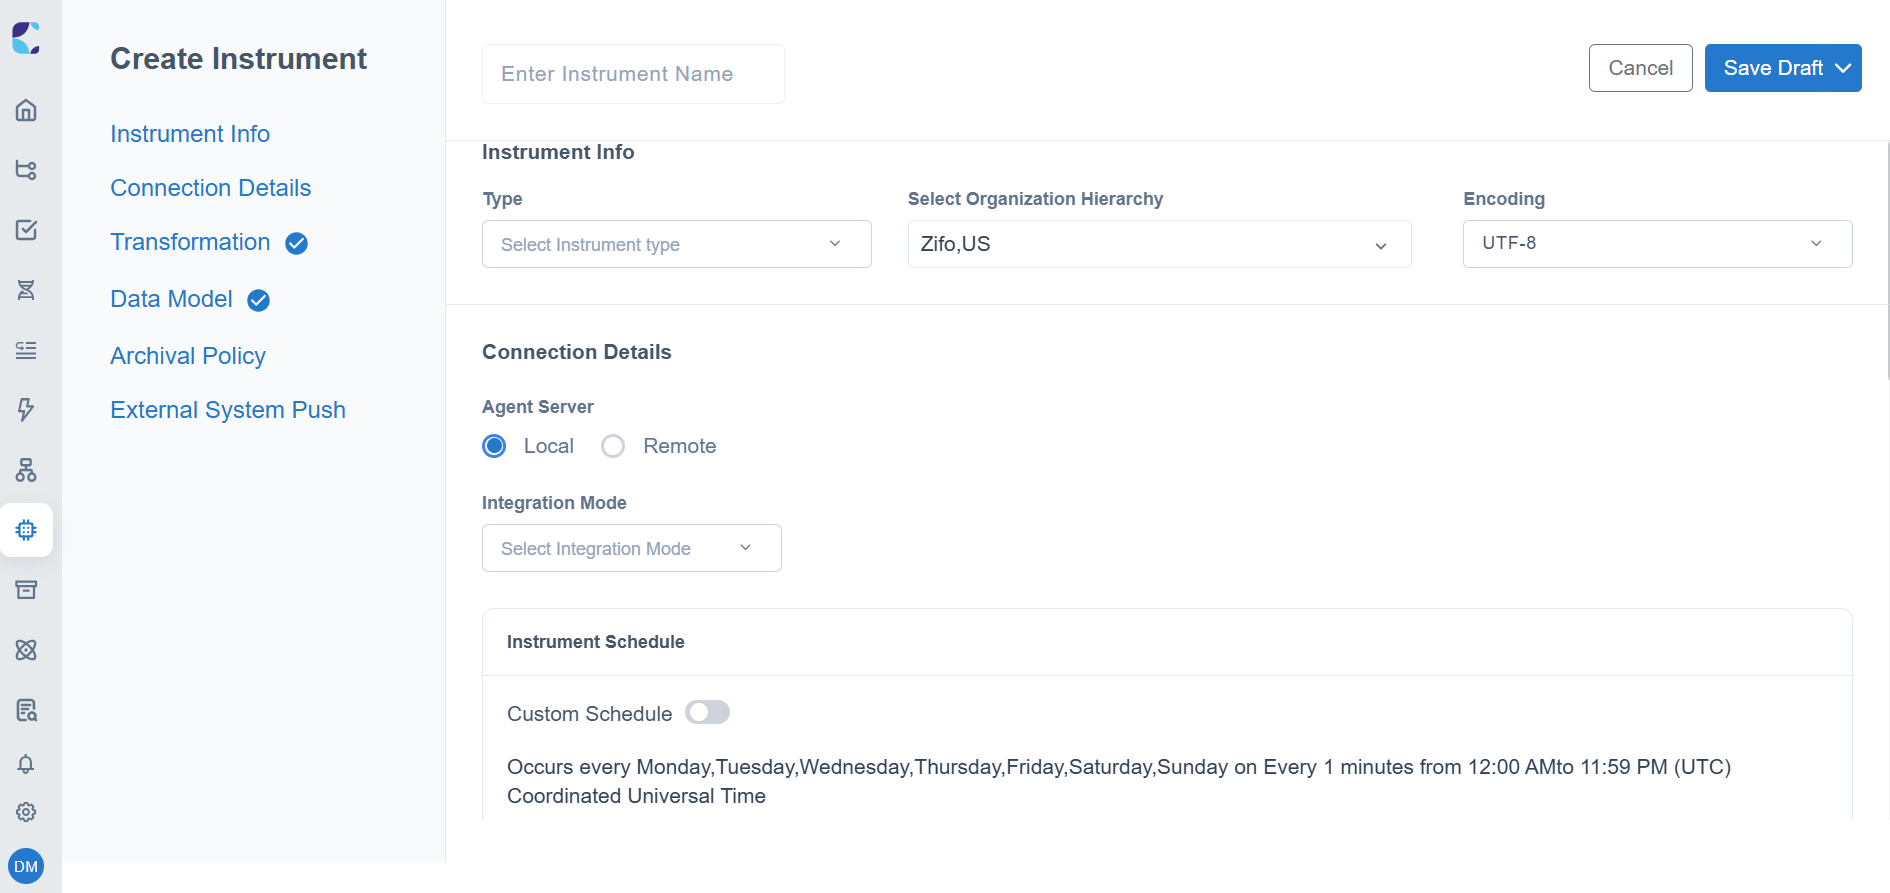
Create Instrument page
Enter an appropriate Instrument name in the respective field.The Create instrument page has 5 sections, namely,
The Create instrument page has 5 sections, namely:
- Instrument Info
- Connection Details
- Transformation
- Archival Policy
- External System Push
You can fill in the necessary sections and create the instrument
Instrument info
- Associate the Instrument to its corresponding Instrument type and Organization path in LDAS.
- Fill in the Encoding type as required. Encoding ensures data integrity when associating instrument data.
- When the external system push is enabled, the ‘Encoding’ field in Instrument Info becomes mandatory to ensure that the data remains intact and unaltered during the external system push.
Connection Details
Connection details section captures how exactly the instrument created in LDAS can connect to different instruments/ applications in laboratory and acquire data, with a wide range of integration modes in place.
Following are the Integration modes available:
File Watcher
It is used when instrument output is in the form of files/folder
DB Query
It is used when instrument output is stored in Database
Rest API
It allows extraction of data from Instruments using Rest API
RS232
It allows extraction of data based on serial communication.
OPCUA
It allows extraction of data from Instruments with OPCUA protocol
OPCHDA
It is used to retrieve historical data from instruments.
File Watcher
Two Initiation methods are available – depending on your use cases, any of the below options can be chosen.
- Push to Folder- For instruments that store output files in a specific location, you can configure the Push to Folder method to automatically monitor the directory for instrument files at scheduled intervals.
- Push over API- Apart from retrieving instrument files based on location, an agent can be used to export the file from the instrument and trigger an activity in LDAS using the “Push over API” method.
Push to Folder
You can set a frequency (Instrument Schedule) based on which LDAS will monitor the specified location and pick the instrument files.
Push over API
You can download the reference document to get inputs on initiating the API call after publishing the instrument.
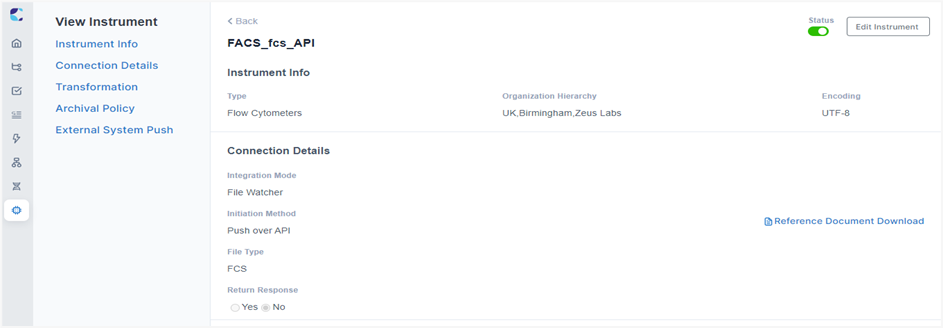
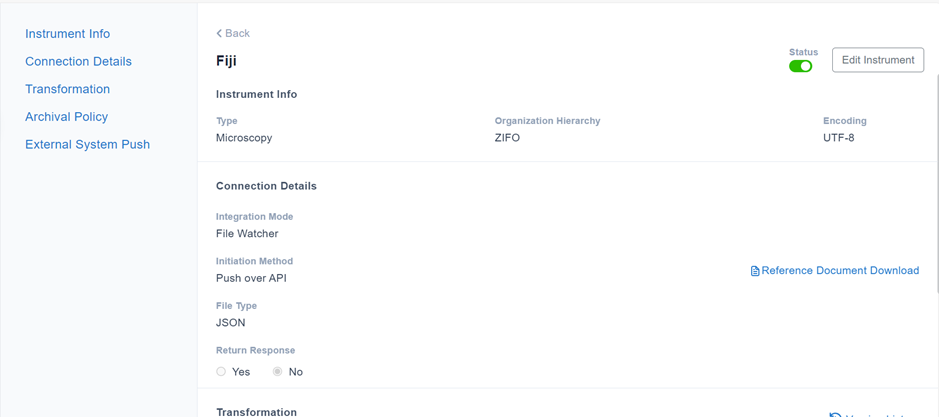
Example configuration – File watcher mode: Push over API
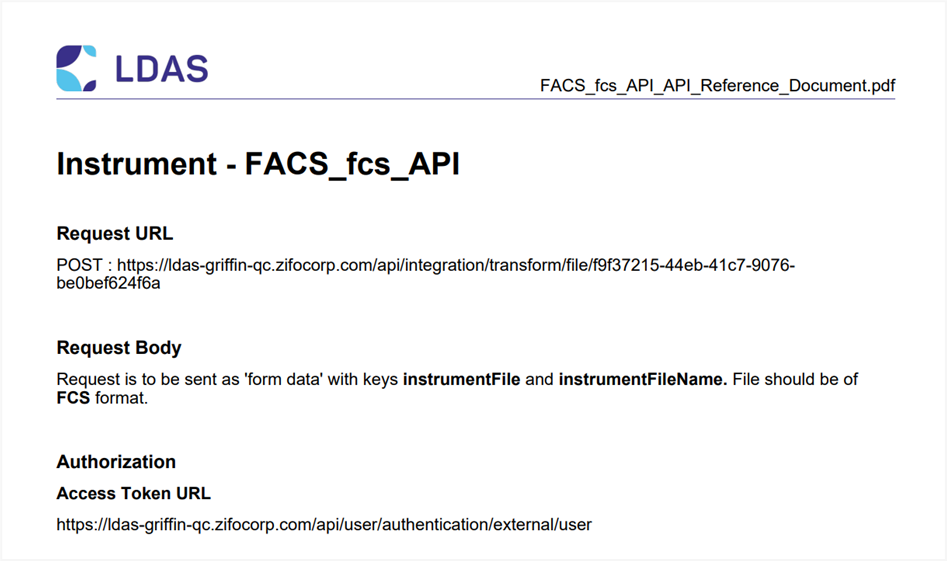
Reference document
File Watcher Configuration:
| Integration Mode | Initiation Method | Details | ||
|---|---|---|---|---|
| File Type | Provide the input file type which will be the output from instruments | Partial system defined Metadata | ||
| File Watcher | Push to Folder | File Location | Local Drive | Input Directory |
| SFTP |
Host Name Username Password Remote Path |
|||
| Minio |
URL Bucket Name Region Access Key Secret Key Prefix |
|||
| S3 |
Bucket Name Region IAM User (Yes/No) Prefix Access Key (if IAM User = No) Secret Key (if IAM User = No) |
|||
| Instrument Schedule | Default Schedule | Inherited from organisation path settings | ||
| Custom Schedule | Default settings being overridden | |||
| Push over API | ||||
| Return Response | Yes/No | When enabled, transformed JSON would be returned as API response | ||
Database Query
Two Initiation methods are available under DB Query. Depending on your use cases, any of the below options can be chosen.
- Scheduled Pull
- Pull from Instrument
Scheduled Pull
Using scheduled pull method, Instrument data can be acquired from the database synchronously at a scheduled time frame based on the Instrument schedule
Pull from Instrument
This method is used to acquire Instrument data dynamically from a Database. After publishing the instrument, you can download the reference document to get inputs on initiating the API call.
DB Query Configuration:
| Integration Mode | Initiation Method | Corresponding Fields |
|---|---|---|
| DB Query | Scheduled Pull | Database Type |
| Username | ||
| Password | ||
| Database URL | ||
| Database Name | ||
| Collection Name (Applicable for Mongo DB) | ||
| Database Query Instrument Schedule | ||
| Pull from Instrument | Database Type | |
| Username | ||
| Password | ||
| Database URL | ||
| Database Name | ||
| Collection Name (Applicable for Mongo DB) | ||
| Database Query | ||
| Return Response (Yes/No) | ||
| Parameterized (Yes/No) |
Rest API
Rest API authentication ensure secures access to instrument data. For authentication you can opt -
- No Auth if authentication is not required.
- Basic Auth (username and password)
- OAuth (access tokens for flexible access).
Depending on your use case, data exchange can be initiated by any of the below options.
- Push from Instrument
- Pull from Instrument
Push from Instrument
The request details are configured, and instrument agent will make API call based on the Instrument schedule to retrieve the data.
Pull from Instrument
This method is used to acquire Instrument data dynamically through API call. Request details are configured where the request can be parameterized with or without return response.
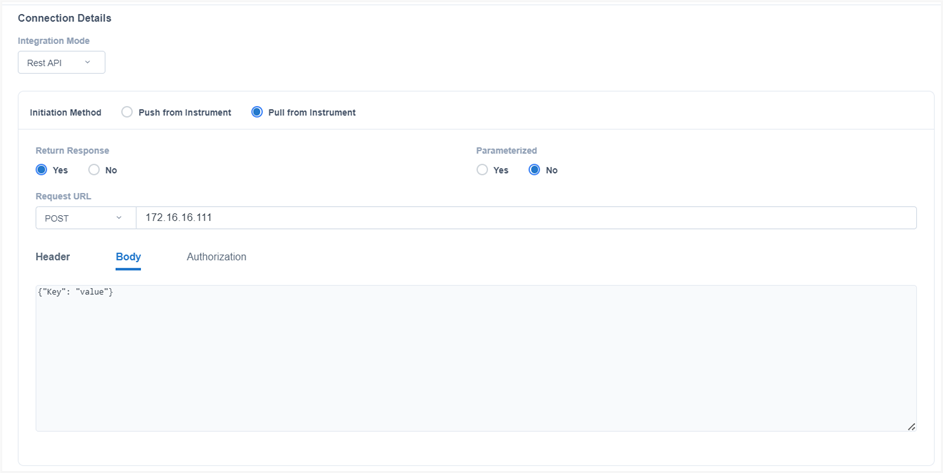
Example configuration – Rest API, pull from instrument
NOTE
“Parameterized” option is applicable only for POST method. So, it is advisable not to enable Parameterized option when GET method is opted.
Rest API Configuration:
| Integration Mode | Initiation Method | Corresponding Fields | |||
|---|---|---|---|---|---|
| Rest API | Push from Instrument | Request Method | POST / GET | ||
| Request URL | |||||
| Headers | Keys & Values | ||||
| Body (Applicable for POST Method) | |||||
Authorization |
OAuth Details:
Grant Type (Password / Client) Access Token URL Client ID Client Secret Username (Applicable for Password) Password (Applicable for Password) |
||||
| Pull from Instrument | Request Method | POST / GET | |||
| Request URL | |||||
| Headers | Keys & Values | ||||
| Body (Applicable for POST Method) | |||||
| Authorization No Auth - No authorization needed Basic Auth - Username and Password OAuth - Password / Client Credentials |
OAuth Details:
Grant Type (Password / Client) Access Token URL Client ID Client Secret Username (Applicable for Password) Password (Applicable for Password) |
||||
| Return Response | Yes / No | ||||
| Parameterized | Yes / No | ||||
RS232 - Pull from Instrument
- This method is used to acquire data from an Instrument dynamically.
- You will have to provide the configuration details to connect to the instrument or instrument agent.
- You can download the reference document and initiate the API call.
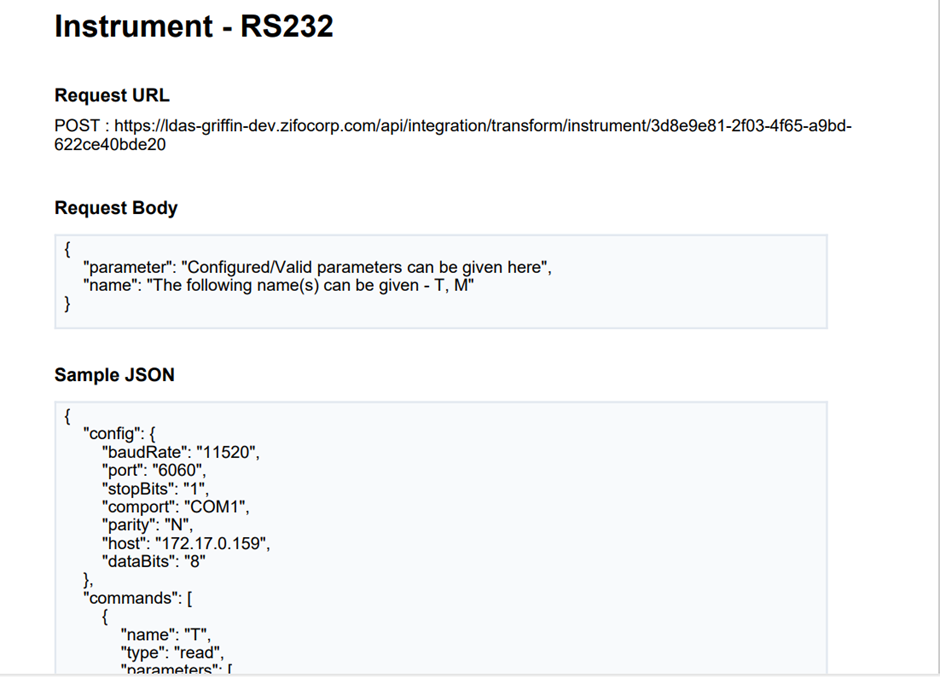
Reference document
OPCUA- Pull from Instrument
- You can use this method to acquire data from Instruments storing data in OPCUA server where LDAS will access the instrument data as a client.
- Configuration details have to be provided to connect to the Instrument or Instrument agent.
- You can download the reference document to get inputs on initiating the API call after publishing the instrument.
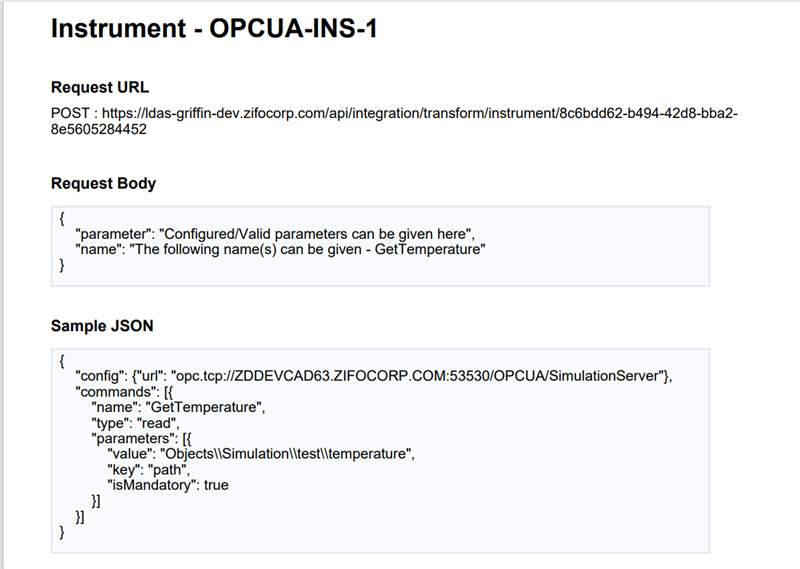
Reference Document
OPCHDA- Pull from Instrument
- You can use this method to acquire historical instrument data from process control and automation systems.
- Configuration details have to be provided to connect to the Instrument or Instrument agent.
- You can download the reference document to get inputs on initiating the API call.
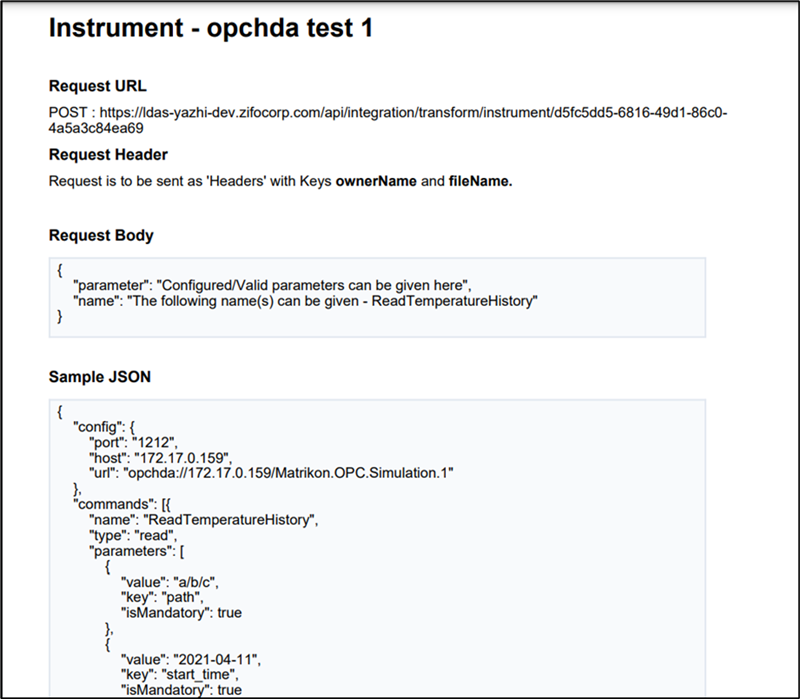
Reference Document
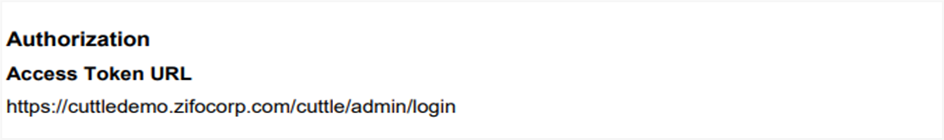
Reference document – authorization
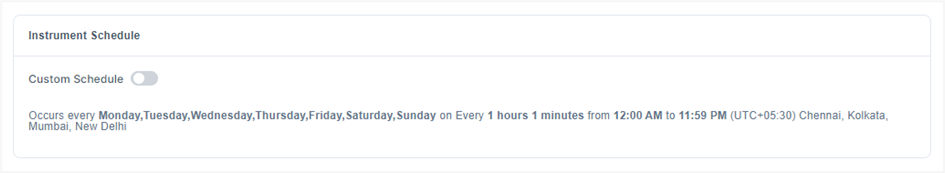
Instrument Schedule
Under Instrument Schedule section, you can set up the frequency in which LDAS should acquire data from instrument.
Default instrument schedule – Inherited from organization path.
By default, the scheduler configuration is inherited from the organization settings, however you can customize the schedule at each instrument level.
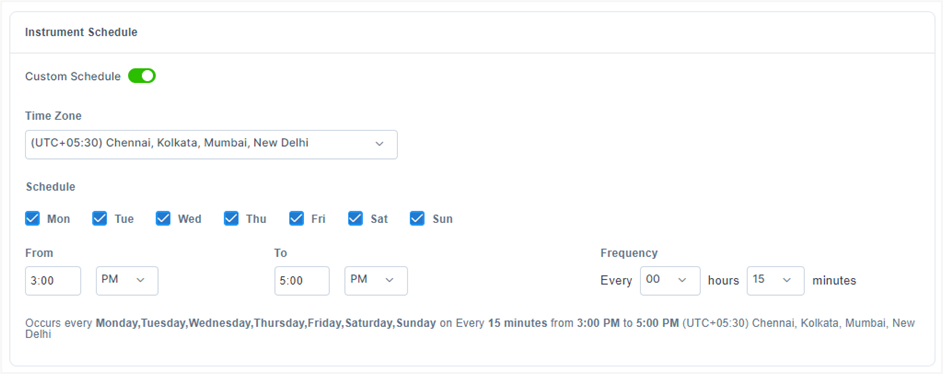
Custom instrument schedule
NOTE
Instrument Schedule does not handle Daylight Saving Time (DST).
Processor
- Each instrument has a processor that can be used to start or stop the instrument.
- Based on the Instrument schedule, processor would be in “Running” state or “Stopped” state.
- You can also manually start/ stop the processor in the Instruments page.
- In case of instrument processor being “Failed”, the log will be available for download.
NOTE
The processor status is shown only for instruments that is configured based on instrument scheduler (i.e., For Instrument with Integration mode: File watcher-Push to Folder, Rest API-Push to instrument, DB Query-Scheduled Pull).
Transformation
After receiving data from the instrument, the data files are transformed into a standardized JSON format to facilitate further processing by a data pipeline or integration with external inventory systems. The files are also enriched with metadata extracted from the instrument file name or path (such as site and sample name) and from the file contents (such as instrument model and injection ID).
Parser
- It is a piece of code to extract information from Instrument data.
- Parsing logics are written to transform data into a structured and standardized JSON format.
- You can upload the parser file in the Parser section (File should be in Zip format).
- Parser should be built as per Parser Guidelines
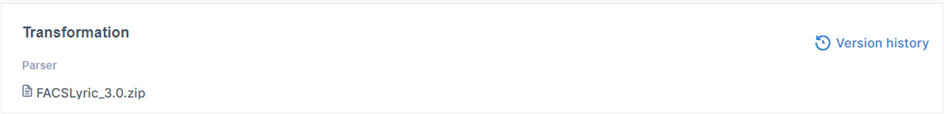
Transformation section, with parser file uploaded
Mapper
- It is a tool that facilitates the alignment, integration and mapping of concepts, properties, and relationships between different ontologies.
- Mapper file would be generated by mapping ontology file with Instrument data file, based on which json content from parser would be transformed to RDF format.
- You can upload the Mapper file in the Mapper section (File should be in .ttl format)
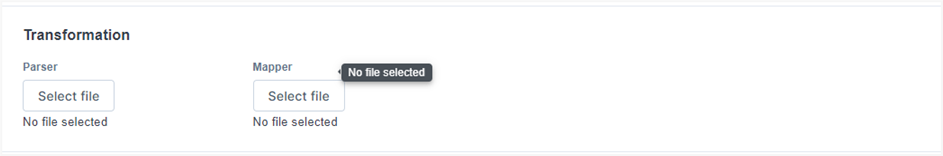
Transformation section, with mapper file upload
NOTE
Mapper is applicable and mandatory when instrument working mode is set as “RDF”.
You can also view the version history of the uploaded parser/ mapper file.
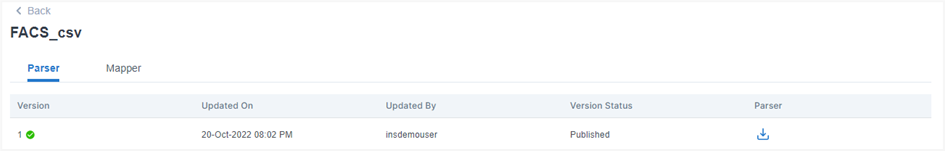
Parser and mapper file version history page
NOTE
Instruments can be configured with or without a Parser. In cases where parser is not used, Instrument raw data would be read and pushed to archive locations, without any processing.
Archival Policy
Raw data from the instrument along with the processed data can be archived in cloud storage, allowing users to search for the required files based on the associated metadata.
Files can be archived either internally within LDAS (Internal Archive) or in any external archives (External Archive) based on the project specific requirements.
Internal archive
- You can select the specific bucket where you want to archive the instrument files from the registered list of buckets.(Refer Bucket Registration for more info on how to register buckets in LDAS)
- Provide Input File Path and Output File Path where the respective Instrument files need to be pushed.
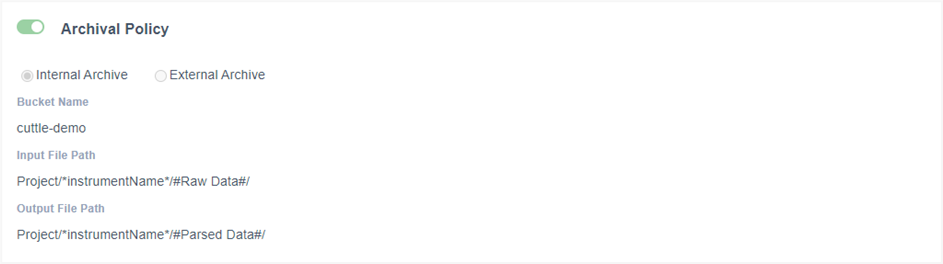
Internal archive configuration
NOTE
Providing file paths for Archival:
- Use “#” to define static values for which folders will be created newly and files would be archived in the given path. File path cannot exceed 246 characters, and the following special characters are restricted.. / \ % :E.g., #Raw Data#, #Parsed Data#.
- Use “*” to get environmental variables. The corresponding name will be created as file path for archivalE.g., instrumentName, instrumentType, orgPath
- You can type ahead and get the metadata keys. If the metadata key is selected, the path will be created based on the corresponding metadata values in the metadata file. The metadata should be present in metadata management E.g., Assay Name, Project
External Archive
To store a large file, you can use an external archive instead of navigating through our archival module. Select "S3" as the "Storage Service" and provide the following details:
- Bucket Name
- Region
- IAM User (Yes/No)
- Prefix
- Access Key (Applicable when “IAM User” = “No”)
- Secret Key (Applicable when “IAM User” = “No”)
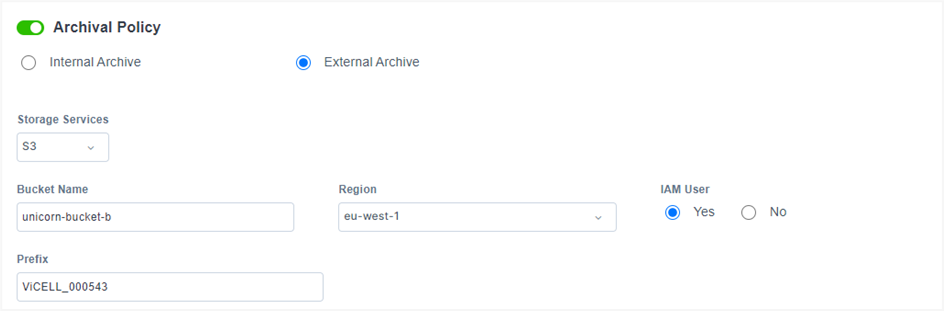
External archive configuration
External System Push
- Integrate with other systems and push Instrument data to your LIMS/ ELN/ data warehouse, or other endpoints with the help of external system push.
- To push results to an external system, the system must first be registered as an endpoint in LDAS.
- Multiple endpoints can be selected, allowing you to send the results to multiple external systems.
- The parser should generate a .result file, which is a JSON file.
- You can also specify a name for the result file based on the selected endpoint, but it must match the .result file name.
Refer to the Endpoints section for more details on endpoint configuration.
External system push configuration
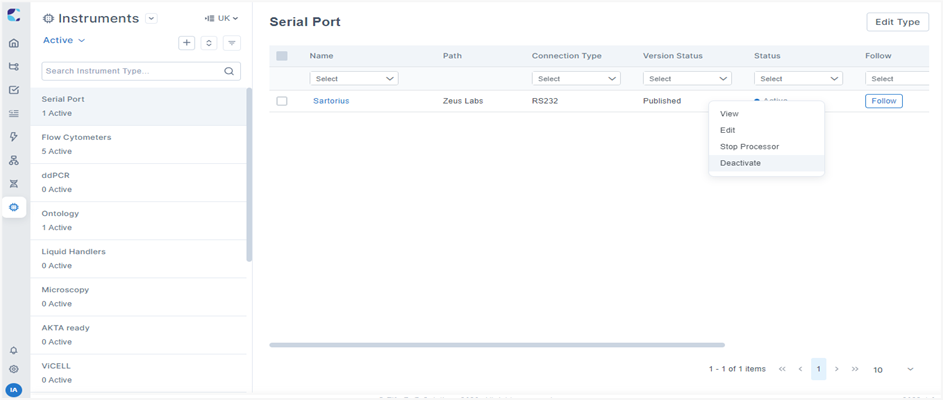
Actions from Instruments List
You can right click on the Instrument or click on triple-dot menu corresponding to the Instrument and perform the following actions.
- View Instrument
- Edit Instrument
- Activate/ Deactivate Instrument
- Start/ Stop Processor
- Follow/Unfollow
- Download Parser/Mapper
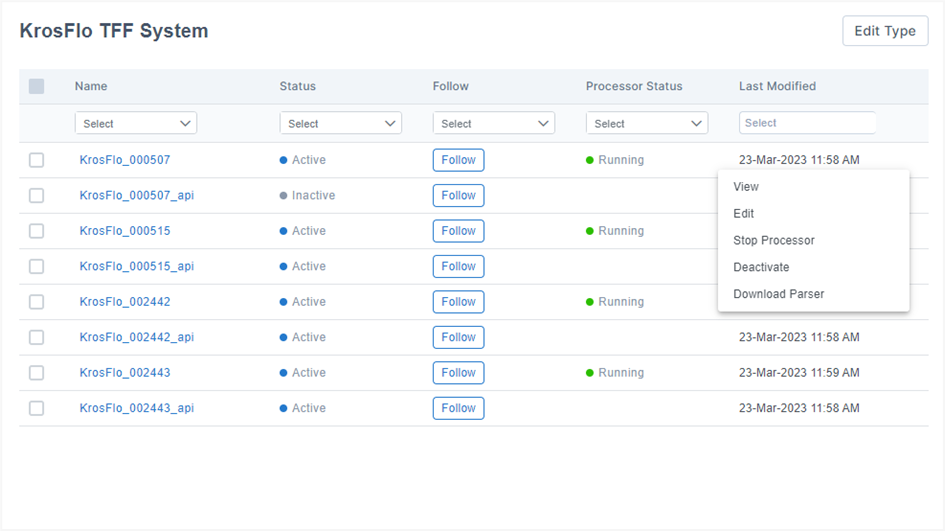
Actions from view instrument list
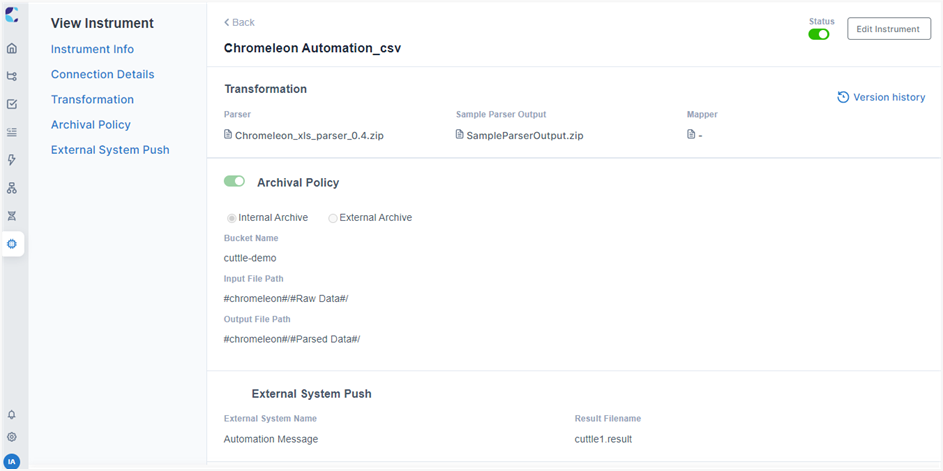
View Instrument
You can view the configuration of the instrument using this option. However, you cannot modify the configuration in View Instrument page.
Edit Instrument
You can make changes to Instrument configuration – Instrument Info, Connection Details, Transformation, Archival Policy, and External System Push, based on the need.
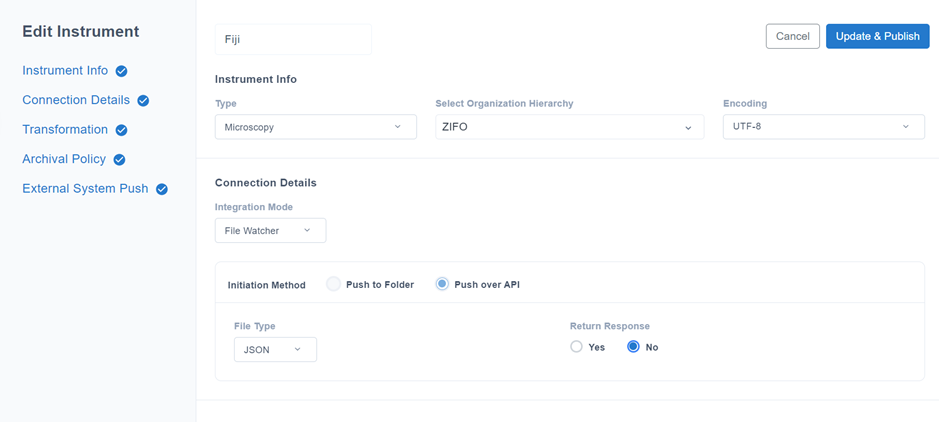
Edit instrument view
NOTE
When Instrument is saved as Draft, all sections (Instrument Info, Connection Details, Transformation, Archival Policy, and External System Push) can be edited.
Section | Description |
|---|---|
Instrument Info | It includes Instrument Type, Organization Hierarchy under which the instrument is created and Encoding. For published Instruments, “Instrument Type” and “Organization Hierarchy” cannot be edited. Only “Encoding” can be edited. |
Connection Details | For published Instruments, the “Integration Mode” and “Initiation Method” cannot be modified. In File watcher mode, you cannot modify the file location. Data base type is non-editable in DB query mode.You can update all the fields under other integration modes- Rest API, RS232, OPCUA, OPCHDA. Based on the initiation method, you can adjust the Instrument schedule based on business needs. |
Transformation | You can update the latest version of parser/ mapper files based on business requirement. |
Archival Policy | For published Instruments, “Archival Policy” section cannot be edited. |
External System Push | You can edit and update the external system push configurations. |
NOTE
- On the instrument page, the file type should not be changed from Folder type to any other type, and vice versa. Instead, you should deactivate the existing instrument and create a new one.
- Once the files have been uploaded and Instrument has been published, Parser and Mapper cannot be removed – only a new version can be uploaded and published.
Activate/ Deactivate Instrument
When you want to stop the instrument permanently or start a stopped instrument, you can use the "Deactivate" or "Activate" options of a published instrument, depending on your requirements.
Activities cannot be triggered for an inactive instrument as the processor status will be stopped for inactive instrument.
Deactivate an instrument
Start/ Stop Processor
When you want to stop the instrument temporarily or start a stopped instrument, you can use the "Stop processor" or "Start processor" options of a published instrument, depending on your requirements.
Activities cannot be triggered if the processor is Stopped.
Follow / Unfollow Instrument
You can "Follow" or "Unfollow" instruments. If you follow an instrument, you will receive notifications whenever any changes are made to its configuration.
Bulk Action
You can make changes to multiple Instruments at a time in a batch operation, instead of doing it separately for each of them.Select necessary Instruments and perform following actions in bulk:
- Follow/ Unfollow Instrument
- Activate/ Deactivate Instrument
- Start/ Stop Processor (This is applicable only to Active Instruments)
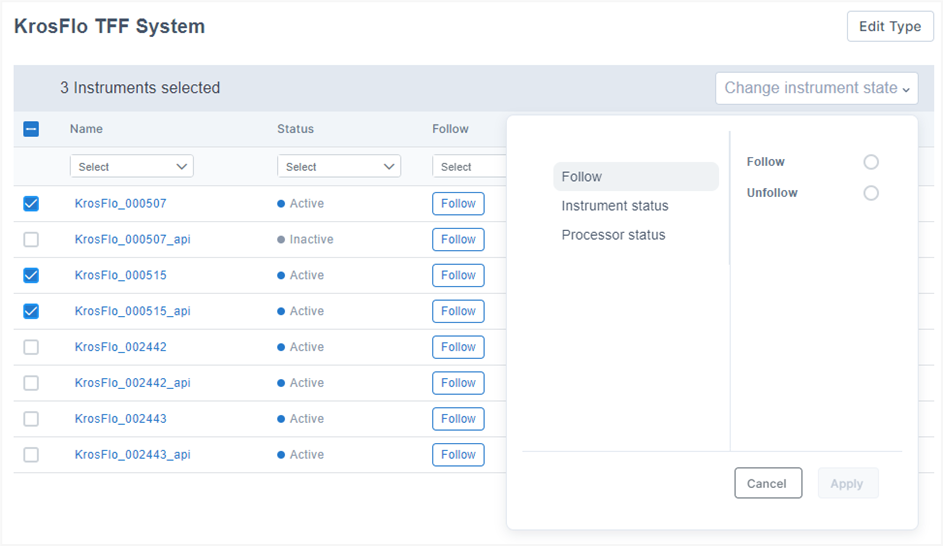
Perform bulk action
NOTE
- For inactive instruments, the processor status will by default be stopped.
- In bulk action, when both active and inactive instruments are selected and the processor status is updated as 'Start', the change will only be applied for the active instruments.
Search and sort Instruments
You can search and filter Instruments based on all columns except “Path”, and sort the Instrument list based on “Name” or “Last Modified” columns.
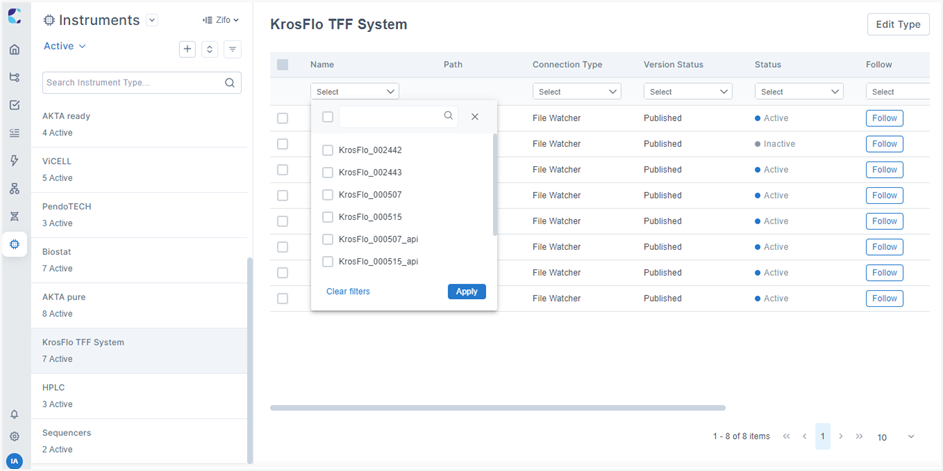
Sort, search, and filter instruments
Troubleshooting
- When you create and publish an Instrument in File watcher integration mode with an invalid directory, the processor status will fail. After updating the Instrument to reflect the active directory, the processor will be in a "Stopped" state. You must manually start the processor for it to move to the "Running" state, even if it is within the scheduled time frame.
- You can download the activity log by clicking the triple-dot menu on the activities page. It contains a record of events that occur in Activities. Download and use the file to troubleshoot problems in the solution. Additionally, you can also download input and output files.
- When the server is down, an unexpected error will be displayed. Check if LDAS Agent Server is running and restart it if necessary.
| Stage | Troubleshoot guidelines |
|---|---|
| Parse Data |
|
| Archive |
|
| External System Push |
|
Updated 5 days ago