User Guide
This section is intended for users of the Instrument module. It provides guidance on generating activities to convert instrument data into a standardized format and subsequently store or push this data to external systems.
Activities
Instrument data can be obtained through various modes such as File Watcher, Database Query, REST API, RS232, OPCUA, and OPCHDA. For each instrument run, LDAS will create an activity to extract the instrument data and track its entire life cycle until the data is transformed and pushed into target application. The data processing status can be tracked and action taken in case of any error.
1. Activity Stages
Depending on the instrument configuration, the activity can have different stages, as mentioned below:
Receive Data
This is the stage where instrument receives data to further process it.
Check Duplicate
If duplicate check is required, you can configure this stage in organization settings page, it checks for duplicate in activities using file name. You can view the history of duplicate activities based on file names. After reviewing the history, you can approve or reject duplicate activity files and complete the process with an e-signature (if e-sign is enabled in organization settings page).
Parse Data
If transformation is required, you need to upload a parser. This parser will transform the raw data into a standardized JSON format. Metadata enrichment can also be performed in this stage.
Review Result
If the transformed data needs to be reviewed before archiving or sending it to external applications, you can enable this stage in organization settings page. You can view or download the results for offline review and then approve or reject the results with an e-signature (if e-sign is enabled in organization settings page).
Archive
If the data needs to be archived, you can enable this stage in the instrument configuration. It can archive both the instrument's data and transformed data in cloud storage.
External System Push
If the data needs to be sent to external applications, you can enable this stage in the instrument configuration. You can configure agents as endpoints in the platform, allowing integration with multiple systems and pushing instrument data to your LIMS, ELN, data warehouse, or other external applications.
2. Different States of an Activity
The status of an activity can be seen and tracked in activities page, enabling you to monitor the instrument run and take the necessary actions as required.
| State | Corresponding Stage |
|---|---|
| In Progress | Receive Data/ Parsing/ Archiving/ External System Push |
| Duplicate | Check Duplicate- Waiting for the user to approve/reject the duplicate |
| Review | Review Result - Waiting for the user to approve/reject the results |
| Rejected | When duplicate/ Review is Rejected |
| Failed | When there is a failure at any stage |
| Completed | When all stages are completed successfully |
NOTE
- If an activity fails, you can use the Re-run option to retry it. This option is available if the failure occurs during the parse stage, archive stage, or external system push stage.
- By default, you can view the activity list with “In Progress” activities sorted from the most recent to the oldest. To view activities with any status, use the ‘All’ filter.
- By hovering over each stage, you can see the start and end dates along with the times. If e-sign is enabled at the organization path level for Check Duplicate/ Review Result, the e-sign details will also be displayed when you hover over the respective stages.
2.1 Re – Run Activities
You can re-run and complete an activity that has failed due to technical issues or invalid configurations. However, you cannot re-run it if there is an issue with the input data or name, you need to fix these at the source and then initiate again. Additionally, you can initiate a re-run for the following stages: Parse Data, External System Push, and Archive.
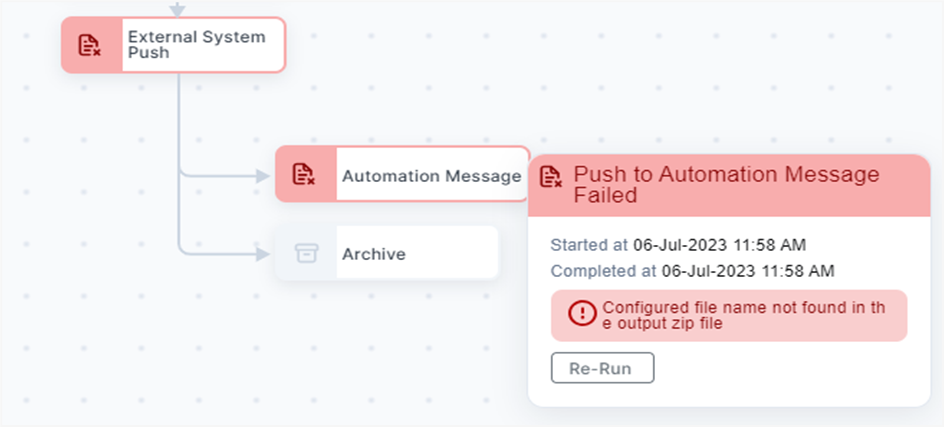
Re-run activity stage
NOTE
When E-Signature is enabled at Organizational level, upon clicking Re-Run for an activity, users have to e-Sign in-order to re-run.
3. View Activities
On the Activities page, you can view both the activity list and detailed activity information. In the Activity List, you can see all the activities generated within the organization path across various instruments. In the Activity Details tab, you'll find specific information about each activity, including the instrument name, the organizational path where the instrument was created, the stages of the activity, the filename, and the received date. If you use File Watcher as the integration mode, the activity name will match the file name. If you use Database Query, Rest API, RS232, OPCUA, or OPCHDA as the integration mode, the activity name will be a random ID.
3.1 Search Activities
- You can search for the desired activity based on
- Instrument Type
- Instrument Name
- File name
- Instrument Name
- Activity Status
- File Received Date
- Recent to Old
- Old to Recent
You can also filter the activities based on
Sort By default, activities are sorted based on recently created (Recent to Old). Activities can be sorted based on the following by clicking sort icon
Home page
When you log into LDAS, the homepage provides you an overview of pending actions and the overall summary of ongoing activities. It allows you to easily identify tasks that needs immediate attention.
The following are the widgets available in Homepage:
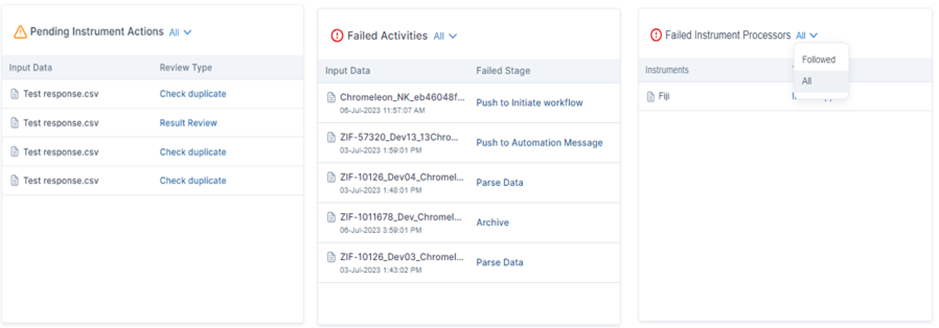
Pending Instrument Actions
It displays the list of instrument files awaiting review, such as “Check Duplicate” and “Review Result”. Based on this you can review the activities.
Failed Activities
It displays the list of instrument activities that have encountered processing failures along with the failed stage. Based on this information, you can fix the issue and re-run the activity as required.
Failed Instrument Processors
It displays the list of instruments that are not in running state due to configuration errors. Based on this information, you can fix the errors in configuration.
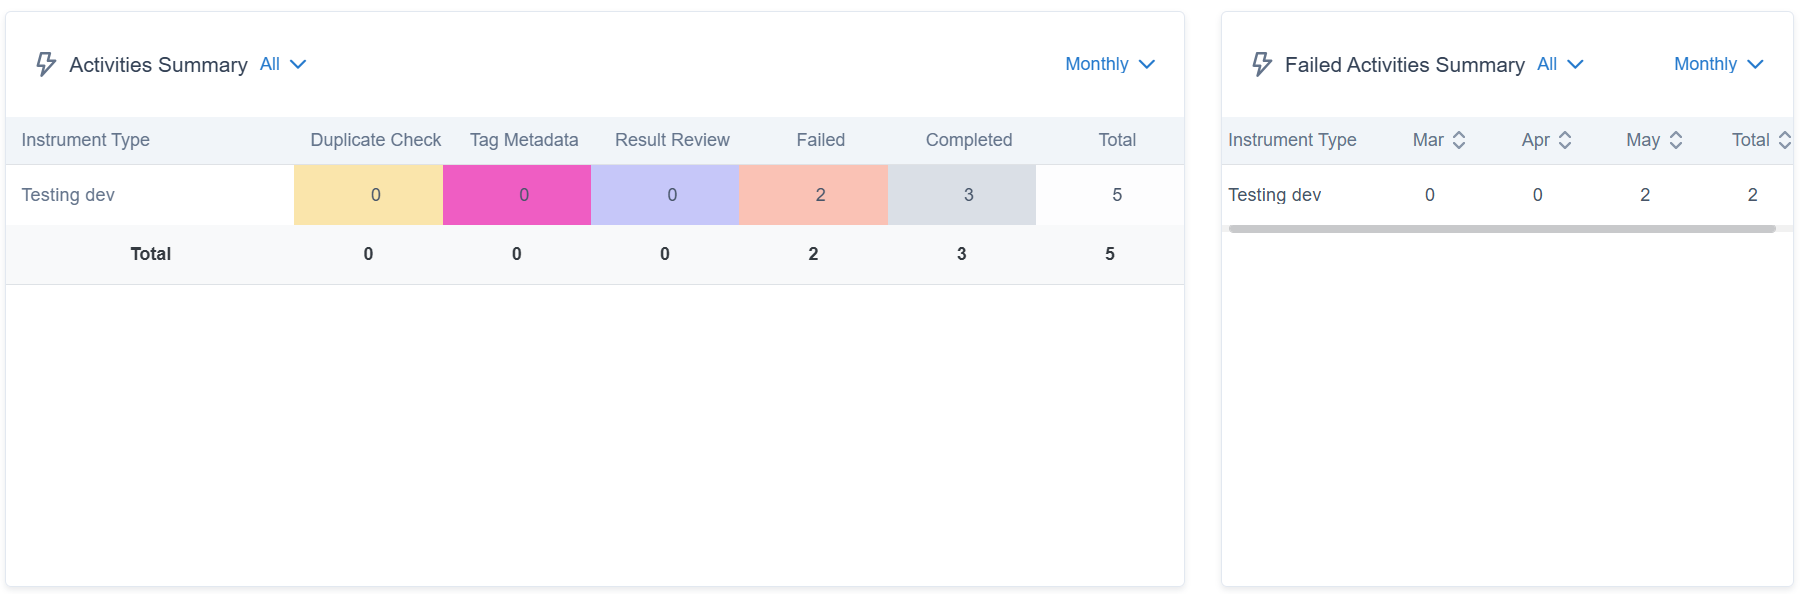
Activities Summary
It displays the total count of activities that are generated throughout the organization path based on their status- Check Duplicate, Review Result, Failed, Completed.
Failed Activities Summary
It displays the count of activities that have failed over a specified timeframe.
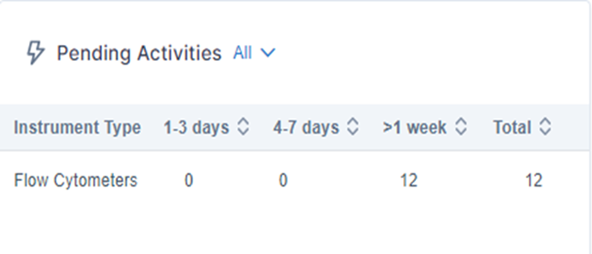
Pending Activities
It displays the count of activities that did not complete till the end or pending for user actions.
- Each widget displays data corresponding to the selected organization path.
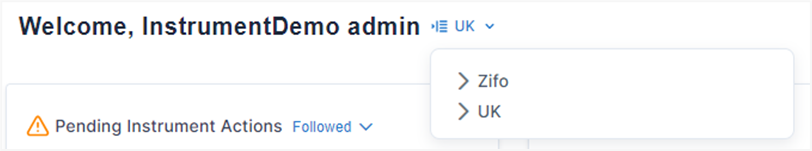
Organization path selection
For each widget, you can choose to
- View the data only for the followed instruments or for all instruments in the organization path.For the widgets- ‘Activities summary’, ‘Failed Activities summary’ and ‘Pending Activities’, if you choose to view the data for ‘All’ Instruments, the data would be grouped based on the instrument type and if you choose to view the data for only ‘Followed’ instruments, the data would be shown for each followed instrument.
- View data on a daily, monthly, or yearly interval.
NOTE
To view the above widgets, you require Instrument module subscription and any one of the following roles: “Instrument Super User”, “Instrument User”, “Reviewer” or “Instrument Viewer”, at the selected organization path.
Updated 5 days ago