User Guide
This section provides the users of the Instrument module with a complete view of how integrated instruments work within LDAS—from data acquisition and processing to monitoring activity or run lifecycles, handling exceptions, and routing results to external systems.
Activities
Instrument data can be obtained through various modes such as File Watcher, Database Query, REST API, RS232, OPCUA, and OPCHDA. For each instrument run, LDAS will create an activity to extract the instrument data and track its entire life cycle until the data is transformed and pushed into target application. The data processing status can be tracked and action taken in case of any error.
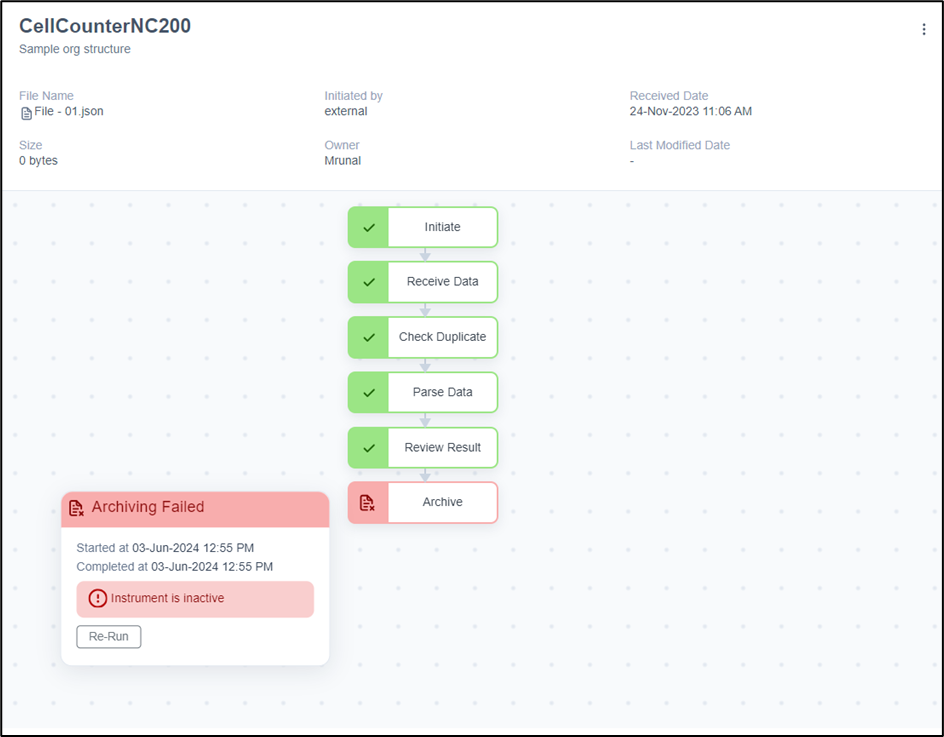
Activity Stages
Depending on the instrument configuration, the activity can have different stages, as mentioned below:
Initiate
This stage will be initiated once the input for that instrument is identified.
Receive Data
This is the stage where instrument receives data to further process it.
Check Duplicate
If duplicate checking is required, you can enable this stage in the Organization Settings page. The system identifies duplicates based on file names and maintains a history of such activities. After reviewing the duplicate history, users can approve or reject the flagged files. If e-signature is enabled, the approval or rejection must be completed with an e-signature.
Tag Metadata
If Tag Metadata is required, you can configure this stage during instrument creation. In the Tag Metadata stage, users from the configured group can either tag metadata or skip the step. If tagging is chosen, metadata values are submitted and linked to the instrument’s input and output files during archival.
Parse Data
If data transformation is required, you can upload a parser to handle the conversion of raw instrument data into a standardized JSON format. During this stage, you can also enrich the data with relevant metadata to support downstream processing and integration.
Map Ontology
This stage involves mapping the ontology file with the instrument data file to generate a mapper file, which is then used to convert the instrument data into RDF format.
Review Result
If the transformed data needs to be reviewed before archiving or sending it to external applications, you can enable this stage in Organization Settings page. You can view or download the results for offline review and then approve or reject the results with an e-signature (if e-sign is enabled in organization settings page).
Archive
If the data needs to be archived, you can enable this stage in the instrument configuration. It can archive both the instrument's raw data and transformed data in cloud storage. Metadata can be tagged to archived files either during the Tag Metadata stage or via a metadata file generated during transformation, enabling file and content searches in Archival.
Push to Systems
Push to Systems enables integration with LIMS, ELN, data warehouses, and other endpoints to transfer instrument data. Through Push to Workflow stage, it connects with the Orchestration module to launch workflows, complete tasks, attach instrument data (as files or links), and pass experiment or sample details as parameters.
Different States of an Activity
The states of an activity can be seen and tracked in activities page, enabling you to monitor the instrument run and take the necessary actions as required.
| State | Corresponding Stage |
|---|---|
| In Progress | Receive Data/ Parse Data/ Archive/ Push to Systems |
| Duplicate | Check Duplicate- Waiting for the user to approve/reject the duplicate |
| Review | Review Result - Waiting for the user to approve/reject the results |
| Rejected | When Check Duplicate or Review Result is Rejected |
| Failed | When there is a failure at any stage |
| Completed | When all stages are completed successfully |
NOTE
- By default, the activity list displays “In Progress” activities, sorted from most recent to oldest. To view activities across all state, use the ‘All’ filter.
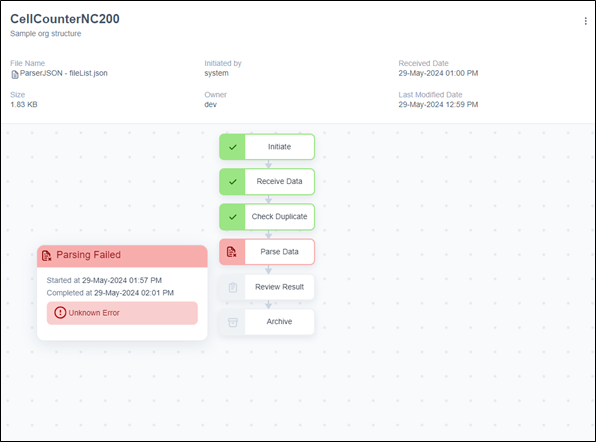
- Hovering over each stage reveals the start and end date-time stamps. If e-signature is enabled at the organization path level for stages like Check Duplicate or Review Result, the corresponding e-sign details will also be visible on hover.
Re – Run Activities
You can re-run and complete an activity that has failed due to technical issues or invalid configurations. However, you cannot re-run it if there is an issue with the input data or name, you need to fix these at the source and then initiate again. Additionally, you can initiate a re-run for the following stages: Parse Data, External System Push, and Archive.
NOTE:Re-run can be initiated for failed activities at any stage prior to the failed stage. If an activity fails at the Archive stage and a re-run is initiated from the Parse Data, and subsequently fails again at the Parse Data, the activity will be marked as failed at both the Parse Data and Archive stages. The date and time of the re-run can be checked to compare details and understand the sequence of failures.
Re-run activity stage
Rerun option not available if file not available in temporary storage
NOTE
- When E-signature is enabled at the Organizational level, users must provide an e-signature to re-run an activity.
- Rerun option will not be displayed when the files get deleted from temporary storage.
View Activities
On the Activities page, you can view both the activity list and detailed activity information. In the Activity List, you can see all the activities generated within the organization path across various instruments. In the Activity Details tab, you'll find specific information about each activity, including the instrument name, the organizational path where the instrument was created, the stages of the activity and the following file attributes:
- File Name - You can view the name of the instrument file that was received either directly from an instrument or through an external system.
- File Size - You can see the size of the instrument file that was received and processed by LDAS.
- Initiated By - You can see the LDAS user who triggered the activity for an instrument. If the activity is system-generated, 'System' will be displayed instead.
- Received Date - You can see the date and time when LDAS received the instrument file and initiated the corresponding activity.
- Owner Name - You can see the owner of the instrument file or data. If the workflow is triggered by an external system, the corresponding username will be displayed.
- Last Modified Date - You can see the timestamp of when the instrument file was last modified by either the user or the system in the shared directory. This is applicable only for the File Watcher – Push to Folder method.
NOTE:
- The filename and owner name can be explicitly defined across all integration modes-whether File Watcher, Database Query, REST API, RS232, OPCUA, or OPCHDA.
- For instruments of type REST API, DB Query, RS232, OPCUA, and OPCHDA, the file name may either be a custom filename sent by the external system that triggered the instrument workflow in LDAS, or the filename returned in the instrument’s response.
This page also allows you to:
- View the file and response details for each activity, ensuring that LDAS adheres to principles of readability and maintainability.
- Download the input/output (I/O) files associated with each activity for further analysis or record-keeping.
Search, Filter & Sort Activities
You can easily find the activity you need by:
Searching using Instrument Type, Instrument Name, or File Name. Filtering results based on Instrument Name, Activity Status, or File Received Date. Sorting activities either from Recent to Old (default) or Old to Recent using the sort icon.
NOTE:You need to manually select an activity from the list to view its details, as the activity details page does not update automatically based on the selected activity.
Home page
When you log into LDAS, the homepage provides you an overview of pending actions and the overall summary of ongoing activities. It allows you to easily identify tasks that needs immediate attention.
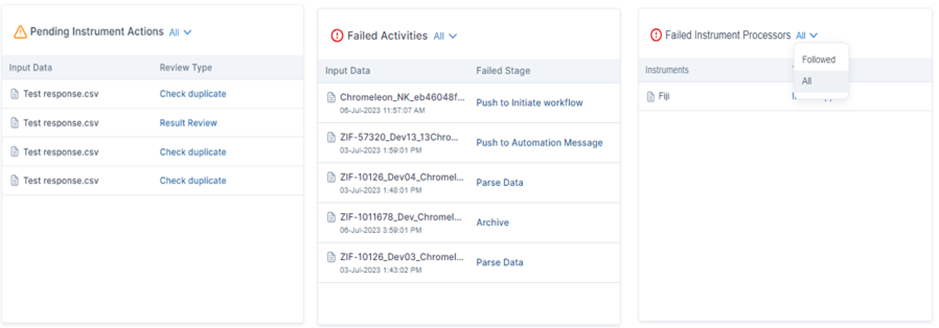
The following are the widgets available in Homepage:
It displays the list of instrument files awaiting review, such as “Check Duplicate” and “Review Result”. Based on this you can review the activities.
It displays the list of instrument activities that have encountered processing failures along with the failed stage. Based on this information, you can fix the issue and re-run the activity as required.
It displays the list of instruments that are not in running state due to configuration errors. Based on this information, you can fix the errors in configuration.
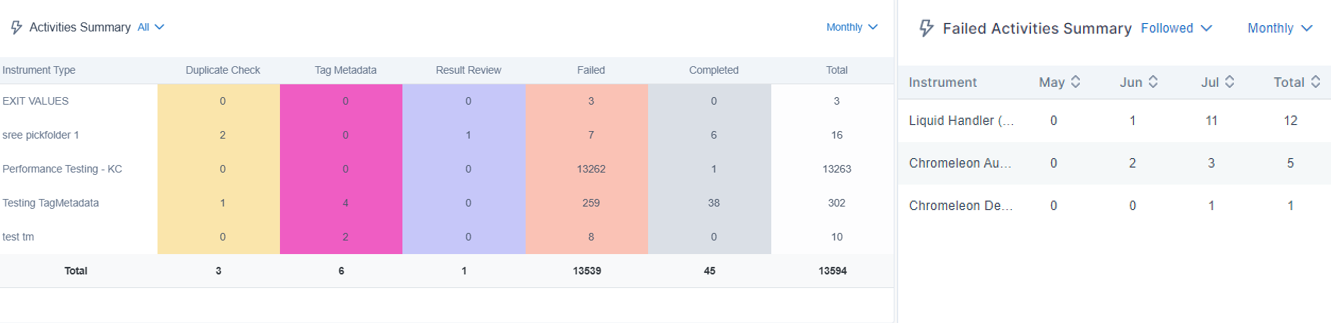
It displays the total count of activities that are generated throughout the organization path based on their status- Check Duplicate, Tag Metadata, Review Result, Failed, Completed.
It displays the count of activities that have failed over a specified timeframe.
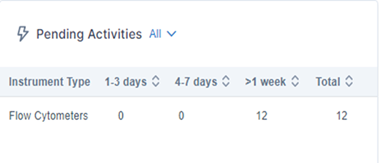
It displays the count of activities that did not complete till the end or pending for user actions.
- Each widget displays data corresponding to the selected organization path.
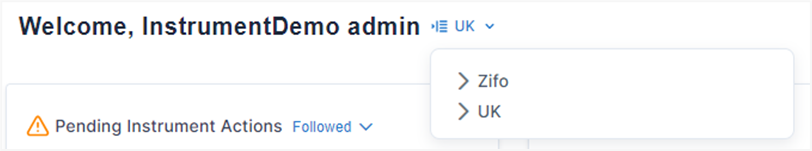
Organization path selection
For each widget, you can choose to
- View the data only for the followed instruments or for all instruments in the organization path. For the widgets- ‘Activities summary’, ‘Failed Activities summary’ and ‘Pending Activities’, if you choose to view the data for ‘All’ Instruments, the data would be grouped based on the instrument type and if you choose to view the data for only ‘Followed’ instruments, the data would be shown for each followed instrument.
- View data on a daily, monthly, or yearly interval.
NOTETo view the above widgets, you require Instrument module subscription and any one of the following roles: “Instrument Super User”, “Instrument User”, “Reviewer” or “Instrument Viewer”, at the selected organization path.